The observability tool that
stays out of your way until you don't want it to.
Observatory is a single-binary metrics, logs, and traces stack. Apache 2.0, SQL-flavored queries, cardinality without overage panic, and a CLI that respects your time. Built by people who have been on call long enough to know what they wish someone had built sooner.
Yes, the brew formula exists. Yes, it actually works. Yes, you can also just curl | shif you trust us. (You probably shouldn't. Read the script first.)
Quickstart
From clone to first query in
less time than your standup.
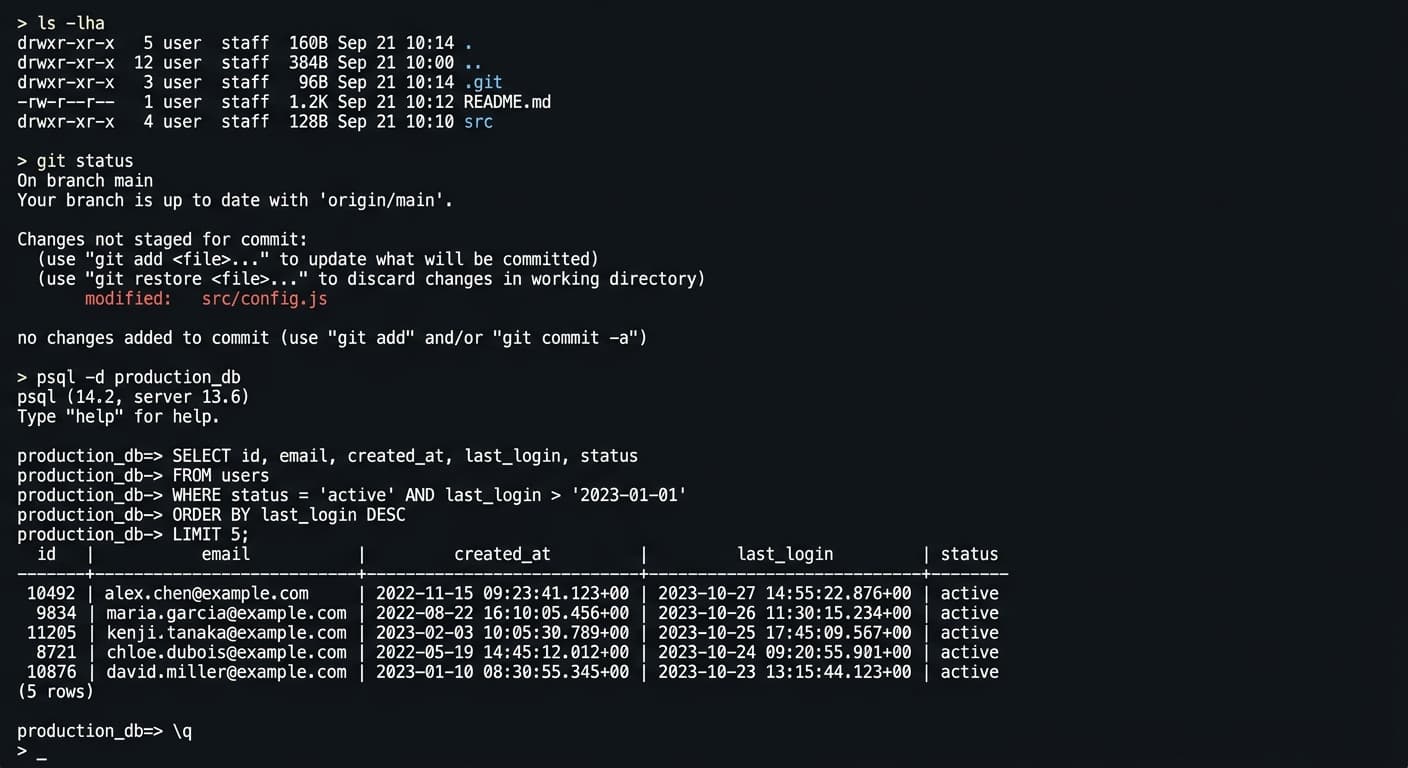
The whole onboarding is below. There's no sales call, no email gate, no “contact us for pricing.” Run the binary, point it at your stack, ask it something.
# macOS / Linux
$ brew install observatory
$ observatory --version
observatory 0.4.2 (linux/amd64)# start a local single-tenant deployment
$ observatory serve --dev
→ ingest listening on :4318 (otlp/grpc)
→ query listening on :4319 (http)
→ ui http://localhost:4320
(everything is on disk. no telemetry. you're fine.)$ observatory query '
SELECT p99(latency_ms) BY service
FROM traces
WHEREdeploy_sha = 'a3f1c9'
SINCE 1h'What you get
Three things, done well.
Not nine, done with a footnote.
Cardinality without the lecture
Tag every metric with whatever you need: customer ID, deploy SHA, region, mood. The bill stays the same. Yes, even mood.
Queries that mean what they say
SQL-flavored, no proprietary DSL, no clever abstraction over a less clever abstraction. If you can describe the question, you can ask it.
On-call, but slightly less awful
Quiet alerts at 3am, opinionated defaults that match what teams actually run, and a runbook field on every alert that nags you until it's filled in.
Made for
The kinds of mornings
we've all had.
It's 03:14 and search is timing out, again.
Get a service map, the most recent error sample, and the deploys from the last two hours, in one query, three keystrokes.
You're the on-call buddy and your buddy is the on-call.
Subscribe to a query and a delta threshold. Observatory pages you only when the slope changes, not the value. Sleep is allowed.
Postmortem is in two hours and the dashboard you trusted has gone weird.
Pin the time window, export the query, drop the link in the doc. Future-you and the rest of the room can read the same thing.
Some VP wants “just one chart.”
Make a chart. Send a link. The link has the query embedded in it. The VP gets the chart. You get to keep working.
Stop reading. Start cloning.
The whole thing is one binary, one config file, and a README that doesn't lie to you about what it does.